
Executive Summary Europe Freight Outlook 2026
As of 14 July 2026, the Asia-Europe ocean market is being shaped by two different chokepoint risks. The Red Sea-Bab el-Mandeb-Suez corridor determines voyage distance, effective vessel capacity and transit time between Asia and Europe. The Strait of Hormuz determines access to Upper Gulf ports and has an outsized influence on oil, LNG, bunker, marine insurance and Middle East hub operations. The two risks can reinforce each other even when a Vietnam-North Europe container does not physically enter the Gulf.
The market is not moving in one direction. Maersk and Hapag-Lloyd have started a selective return of some services through Suez, which is a medium-term bearish signal for freight rates because shorter voyages release capacity. At the same time, attacks around Hormuz, carrier booking restrictions, emergency operating arrangements and lower vessel traffic are keeping energy and network risk elevated. Drewry’s 9 July benchmark showed Shanghai-Rotterdam at USD 4,933/40ft and Shanghai-Genoa at USD 6,463/40ft. Xeneta’s 10 July market averages were USD 5,503/FEU to North Europe and USD 6,855/FEU to the Mediterranean, with rates broadly flat week on week after sharp increases since late February.
For Vietnam shippers, the base case is firm pricing through late July and early August, followed by a plateau or moderate easing if Suez normalisation expands and peak demand fades. A renewed security shock could quickly reverse that view. The recommended strategy is to protect urgent cargo, split volume across rate windows, maintain carrier alternatives and compare all-in cost and schedule reliability rather than chasing a single headline rate.
|
Decision Summary • Red Sea risk is primarily a distance, capacity and schedule problem; Hormuz risk is primarily an energy, insurance, Gulf-access and hub-disruption problem. • Selected Suez resumptions are a meaningful capacity signal, but they are gradual, conditional and reversible. • Asia-Europe spot benchmarks reached two-year highs in early July, but Xeneta data showed a pause in weekly increases by 10 July. • Vietnam-origin offers can sit below or above China/Far East indices because of POL, direct versus transshipment service, account allocation and surcharge inclusion. • Book critical cargo early, but avoid locking all flexible volume at the top of a volatile market. |
Current Situation as of 14 July 2026
The Middle East operating environment remains severe. The International Maritime Organization reported 53 confirmed incidents and 14 seafarer fatalities in the Middle East and Strait of Hormuz as of 13 July 2026. On 8 July, the IMO Secretary-General condemned new attacks on commercial ships and urged authorities and operators not to expose seafarers to unnecessary danger.
Reuters reported on 13 July that Hormuz traffic had slowed to a two-month low following renewed United States-Iran strikes and increased safety risk. This matters beyond the tanker market because carrier decisions, bunker prices, war-risk premiums, port access and feeder networks respond to the same security environment.
At the same time, the Suez story is changing. Maersk and Hapag-Lloyd announced selected trans-Suez resumptions under the Gemini network, and Maersk added another Red Sea service on 13 July. Earlier Maersk guidance indicated that a Suez return on the relevant service could reduce westbound transit by about seven days and eastbound transit by up to 14 days. The market therefore faces a tension between route normalisation through Suez and continuing instability around Hormuz and the wider Middle East.
|
Chokepoint |
Direct Shipping Effect |
Cost Transmission |
Most Exposed Cargo |
|
Red Sea / Bab el-Mandeb / Suez |
Cape rerouting extends voyage and vessel cycle; schedule reliability falls |
Higher effective capacity demand, fuel use, equipment imbalance and transit buffer |
Asia-Europe, Asia-Mediterranean, Europe-Asia, Red Sea trades |
|
Strait of Hormuz |
Upper Gulf access, port calls and feeder operations disrupted |
Oil, LNG, bunker, war-risk insurance, emergency routing and hub congestion |
Gulf cargo directly; all trades indirectly through energy and deployment |
|
Combined shock |
Carriers manage two operating theatres at the same time |
Vessel redeployment, surcharges, transshipment pressure and higher uncertainty |
Time-critical, reefer, high-value and contract-sensitive cargo |
Table 1. Red Sea and Hormuz are different risks, but their cost channels can compound. Europe Freight Outlook 2026
How the Risk Reaches a Vietnam-Europe Quotation
Europe Freight Outlook 2026 Red Sea: Voyage Distance and Effective Capacity

When a vessel avoids Suez and sails around the Cape of Good Hope, the nominal fleet does not shrink, but the number of round voyages it can perform falls. UNCTAD estimated that Red Sea diversions increased demand for container-ship capacity by about 12% between mid-December 2023 and June 2024. This explains why large newbuilding deliveries did not automatically collapse rates: extra tonnage was absorbed by longer sailing distances and higher schedule buffers.
A broad Suez return has the opposite effect. Shorter voyages release effective capacity and reduce bunker consumption. However, the benefit is not immediate. Network re-phasing can initially create vessel bunching, port omissions, blank sailings, equipment imbalance and inconsistent arrival dates. A pricing manager should therefore expect a four-to-eight-week transition between a routing decision and a stable rate effect.
Europe Freight Outlook 2026 Hormuz: Energy, Insurance and Gulf Network Risk
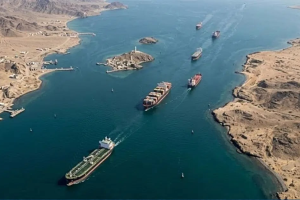
The Strait of Hormuz is the world’s most important oil chokepoint. EIA data show about 20 million barrels per day moved through the strait in 2024, equivalent to roughly 20% of global petroleum liquids consumption and more than one-quarter of global seaborne oil trade. Around one-fifth of global LNG trade also passed through Hormuz. EIA’s 1Q26 energy-security data showed oil flows at 14.6 million barrels per day, down from 20.4 million in 1Q25, and LNG flows at 7.3 billion cubic feet per day, down from 11.7 billion.
A container from Ho Chi Minh City to Rotterdam may never enter Hormuz, but it still buys bunker in a global energy market and competes for vessels, insurance capacity and transshipment slots in a network affected by Gulf disruption. Port restrictions at Jebel Ali, Dammam, Salalah, Khor Fakkan or feeder hubs can also cause cascading delays on services that share vessels or connections with Europe trades.
What Carriers Are Actually Doing
|
Carrier / Authority Signal |
Date |
Operational Meaning |
Pricing Implication |
|
Maersk selected Suez resumptions and additional Red Sea service |
6-13 Jul 2026 |
Gradual re-entry, not full network normalisation |
Medium-term downside pressure if expanded; short-term volatility during re-phasing |
|
Maersk Middle East Operational Update 38 |
8 Jul 2026 |
Booking suspensions and alternative landbridge / port solutions remain in place |
Emergency costs and network risk remain elevated |
|
Hapag-Lloyd Upper Gulf live ticker |
Updated 9 Jul 2026 |
Avoiding Hormuz with third-party feeders for Upper Gulf cargo |
Feeder, handling, insurance and schedule premiums can persist |
|
Hapag-Lloyd Middle East Emergency Surcharge |
26 Jun 2026 |
Alternative routing, extra vessels, terminal and insurance costs for affected cargo |
Confirms direct cost recovery on Gulf disruption |
|
IMO confirmed incident count |
13 Jul 2026 |
53 incidents and 14 fatalities |
Security risk is operational, not theoretical |
Table 2. Selected operational signals as of 14 July 2026.
The carrier strategy is therefore asymmetric. Lines are testing shorter Suez routing where security and network design allow, while maintaining contingency arrangements around Hormuz. They are also protecting yield through FAK increases, PSS, emergency surcharges and selective capacity management. A shipper should not assume that lower sailing distance will immediately remove surcharges or reduce quoted rates.
Where Asia-Europe Freight Rates Stand
|
Benchmark / Market Signal |
Date |
North Europe |
Mediterranean |
Interpretation |
|
Drewry WCI Shanghai benchmark |
9 Jul 2026 |
USD 4,933/40ft to Rotterdam; +5% WoW |
USD 6,463/40ft to Genoa; +2% WoW |
Rates still rising; WCI global index reached USD 4,639/40ft. |
|
Xeneta Far East market average |
10 Jul 2026 |
USD 5,503/FEU; -0.2% WoW |
USD 6,855/FEU; -0.9% WoW |
A pause after major increases; still +148% and +106% versus end-February. |
|
CMA CGM published FAK |
15-31 Jul 2026 |
Carrier FAK context around USD 7,000/40ft cited by Drewry |
USD 7,900 West Med to USD 8,500 East Med/40ft |
Published FAK is a ceiling/reference structure, not the same as every Vietnam account offer. |
|
Interchains Vietnam market signal |
14 Jul 2026 |
Selected HCM offers around USD 4,500/40HC; HPH about USD 100 higher; validity 20 Jul-5 Aug |
Generally carries a material premium versus North Europe |
Actual Vietnam offers reflect origin, carrier, route, account and surcharge inclusion. |
Table 3. Current Asia-Europe benchmarks and Vietnam-origin market signal.
Rate disclaimer: indices and published FAK levels are benchmarks. The Interchains signal is indicative for standard dry cargo and must be rechecked for POL, POD, commodity, weight, equipment, service, free time and surcharge inclusion.
Why the numbers differ: Drewry is a Shanghai route benchmark, Xeneta aggregates Far East market data, CMA CGM publishes tariff-level FAK structures, and a Vietnam quotation is shaped by Ho Chi Minh City, Cai Mep or Hai Phong origin, direct or transshipment routing, account allocation, equipment position and local market competition. A USD 4,500 offer can be commercially real even when a broader index is above USD 5,000, but the buyer must confirm whether PSS, ETS, security, origin charges and destination charges are included.
Demand, Capacity and Carrier Behaviour
Demand remains difficult to separate from front-loading. The early-July rate spike was supported by peak-season cargo and wider trade-policy uncertainty, while some shippers accelerated orders to protect inventory. If that demand is mainly front-loaded rather than sustained consumption, booking pressure can weaken in August or September.
Capacity is moving in different directions by sub-trade. Xeneta reported offered capacity for Far East-North Europe up 3.1% week on week in the week commencing 6 July, while Far East-Mediterranean capacity was down 2.3%. This helps explain why Mediterranean pricing remains structurally higher and may correct later than North Europe. Drewry reported only four announced blank sailings on Asia-Europe for the following week, yet rates remained high, suggesting the market was still absorbing peak and operational pressure rather than being supported only by cancellations.
Carrier strategy will determine the speed of any decline. If carriers accept lower utilisation to protect market share, rates can fall quickly. If they use blank sailings, port omissions and FAK discipline to protect yield, the market may plateau at elevated levels. The gap between spot and annual-contract rates will also influence how much cargo moves into the open market.
Europe Freight Outlook 2026: Three Scenarios for the Next 8-12 Weeks
|
Scenario |
Probability |
Key Assumptions / Triggers |
Vietnam-North Europe 40HC Planning Band |
Mediterranean Implication |
|
Base case: firm then gradual easing |
50% |
Selective Suez return expands slowly; Hormuz remains risky but not fully closed; peak demand fades after early August; capacity rises |
Late Jul-Aug: USD 4,400-5,100; Sep: USD 4,000-4,700 |
Premium of roughly USD 1,000-1,800 depending on port, routing and capacity |
|
Upside risk: renewed security shock |
30% |
New attacks reverse Suez return; oil/insurance rises; Gulf hub disruption spreads; carriers cut or redeploy capacity |
USD 5,300-6,500 or higher on constrained weeks |
Could move toward USD 6,800-8,500+ with stronger port and service dispersion |
|
Downside case: faster normalisation |
20% |
Broader Suez restoration; Hormuz traffic improves; front-loading ends; carriers compete for volume |
Aug-Sep: USD 3,500-4,400 |
Falls later and remains above North Europe due to service structure and congestion risk |
Table 4. Interchains scenario forecast for standard dry cargo. These are planning bands, not quotations.
The base case has the highest probability because the market contains opposing forces. Suez normalisation and added offered capacity are bearish, while Hormuz risk, peak-season demand, Mediterranean capacity pressure and carrier yield management are bullish. The rate path is therefore more likely to be a plateau followed by a controlled easing than an immediate collapse.
The trigger for a more aggressive decline is not one successful Suez transit. It is a sustained increase in the number of services using Suez, stable security over several weeks, improved schedule reliability, lower bunker and insurance costs, and visible competition for bookings. Conversely, a single serious attack on a container vessel, tanker or port facility could move the market into the upside scenario within days.
Recommended Booking Strategy for Vietnam Shippers
|
Cargo Profile |
Primary Risk |
Recommended Action |
Timing |
|
Production-critical or fixed retail delivery |
Rollover and late arrival cost more than rate difference |
Secure space with a reliable carrier; add transit buffer; avoid the cheapest unconfirmed allocation |
Book 3-4 weeks ahead; earlier for Mediterranean or peak weeks |
|
Flexible replenishment cargo |
Locking all volume at a temporary high |
Split volume across two or three sailing weeks and preserve spot optionality |
Review rates every 7-10 days |
|
Regular monthly volume |
No protection against sudden GRI or space shortage |
Use a blended fixed/FAK and spot strategy; negotiate allocation and free time |
Set rolling 4-8 week allocation |
|
High-value, reefer or time-sensitive cargo |
Security, connection and claim exposure |
Prioritise direct/low-transshipment service, insurance, monitoring and contingency routing |
Book early and confirm operational acceptance |
|
Heavy cargo from Hai Phong |
Equipment, feeder and weight restriction |
Confirm 40HC availability, gross weight, feeder acceptance and transshipment cut-off |
Before quotation is committed to customer |
Table 5. Booking strategy by cargo profile.
- Do not panic-book the entire quarter. Protect urgent cargo first and keep flexible cargo exposed to future rate reductions.
- Compare direct and transshipment options using total transit risk, not only proforma transit time.
- Ask whether the quote includes PSS, ETS, LSS, security or contingency charges, origin THC, documentation and destination costs.
- Confirm equipment and real space separately. A low rate without allocation is not a usable rate.
- Maintain at least one backup carrier or NVOCC, especially for Mediterranean and time-critical cargo.
- Negotiate free time and destination terms before booking; schedule volatility can convert quickly into demurrage and detention.
- Use cargo insurance appropriate to the commodity and route. Carrier liability is limited and does not replace insurance.
- Build a transit buffer of at least 7-14 days for customer commitments while the network is re-phasing.
Weekly Trigger Points to Monitor
- Number of mainline services that structurally return to Suez, not isolated trial voyages.
- New IMO, UKMTO and carrier security notices around Hormuz, Bab el-Mandeb and the Gulf of Aden.
- Drewry Shanghai-Rotterdam and Shanghai-Genoa, Xeneta Far East-Europe averages, and SCFI Europe components.
- Offered capacity, blank sailings, port omissions and vessel deployment on North Europe versus Mediterranean trades.
- Oil, VLSFO and marine war-risk insurance movements following security events.
- Vietnam-origin space and 40HC equipment at Ho Chi Minh City, Cai Mep and Hai Phong.
- Validity of local carrier and NVOCC offers, especially whether mid-month GRI or PSS is accepted by the market.
- European import demand, inventory, factory schedules and signs that July front-loading is fading.
Interchains Insight: Manage Probability, Not a Single Rate Number
In this market, a single forecast number creates false confidence. The better pricing method is to define a base, upside and downside case, assign trigger points and allocate cargo by urgency. A current selected offer around USD 4,500/40HC from Ho Chi Minh City for late-July to early-August validity can be attractive for fixed-delivery cargo, even though some global benchmarks are higher. The same offer may be unsuitable for flexible cargo if Suez normalisation accelerates and rates ease in late August.
Interchains supports customers with carrier and NVOCC comparison, rate and surcharge checking, direct-versus-transshipment analysis, space and equipment confirmation, free-time review, customs coordination and door-to-door planning. The commercial objective is to balance freight cost, schedule reliability and inventory risk – not to win a quotation that cannot be executed.
Europe Freight Outlook 2026
Frequently Asked Questions
- Are the Red Sea and the Strait of Hormuz the same shipping risk?
No. Red Sea and Suez disruption changes Asia-Europe distance and effective vessel capacity. Hormuz disruption affects Gulf access, energy, bunker, insurance and Middle East hubs.
- Have carriers fully returned to the Suez Canal?
No. Selected services have resumed or announced trans-Suez routing, but the return is gradual, conditional and reversible. Contingency plans remain active.
- Why can Europe rates stay high if Suez transit is shorter?
Network re-phasing takes time, peak demand remains, carriers may protect yield, and Hormuz-related energy and operating costs can persist. Shorter routing does not immediately remove surcharges.
- What were the latest North Europe benchmarks?
Drewry assessed Shanghai-Rotterdam at USD 4,933/40ft on 9 July 2026. Xeneta reported a Far East-North Europe market average of USD 5,503/FEU on 10 July.
- Why is Mediterranean freight more expensive than North Europe?
Mediterranean services have different network structures, capacity allocation, transshipment exposure and port congestion. Xeneta also reported a week-on-week capacity decline to the Mediterranean while North Europe capacity increased.
- Is a China or Far East index the same as a Vietnam quotation?
No. Vietnam rates depend on POL, direct or transshipment service, account allocation, equipment, local competition, validity and surcharge inclusion.
- Should shippers lock a long-term fixed rate now?
A blended approach is safer: protect a portion of regular volume with allocation or FAK and retain a portion on spot to benefit if rates ease.
- How early should Vietnam-Europe cargo be booked?
Critical North Europe cargo should generally be planned three to four weeks ahead in the current market. Mediterranean, reefer or high-value cargo may require more lead time.
- Could Europe rates fall quickly?
Yes, if Suez normalisation broadens, Hormuz risk declines, front-loading fades and carriers compete for volume. However, a new security event can reverse the decline immediately.
- What is the biggest risk besides the ocean rate?
Schedule reliability, rollover, transshipment delay, equipment shortage, free time and missed production or retail windows can cost more than a few hundred dollars of freight difference.
The near-term Europe market is likely to remain firm and volatile through late July and early August. The medium-term direction depends on whether selective Suez resumptions become a broad structural return, whether Hormuz traffic and Gulf operations stabilise, and whether peak demand is genuine or mainly front-loaded. North Europe has a better chance of easing first; Mediterranean rates may retain a larger premium because capacity and port structures are tighter.
Vietnam shippers should protect urgent cargo, split flexible volume, maintain carrier alternatives and recheck all-in costs every one to two weeks. Contact Interchains for current Vietnam-Europe rate checks, routing comparison, space and equipment confirmation, and a booking plan aligned with cargo urgency and delivery commitments.
All market-sensitive statements were checked against sources available as of 14 July 2026. Global indices are benchmarks and must not be treated as binding Vietnam-origin quotations.
Drewry – World Container Index (9 Jul 2026)
Xeneta – Weekly ocean container market update (10 Jul 2026)
Reuters – Maersk resumes another Red Sea service (13 Jul 2026)
Reuters – Hormuz traffic slows to two-month low (13 Jul 2026)
IMO – Middle East confirmed incidents (13 Jul 2026)
IMO – Statement on new attacks in Hormuz (8 Jul 2026)
Maersk – Middle East operational updates (8 Jul 2026)
Hapag-Lloyd – Upper Gulf and Middle East live ticker (updated 9 Jul 2026)
Hapag-Lloyd – Middle East Emergency Surcharge (26 Jun 2026)
U.S. EIA – Hormuz critical oil chokepoint (16 Jun 2025)
U.S. EIA – Global Energy Security Data (2026 dataset) – https://www.eia.gov/outlooks/steo/report/energysecurity/article.php
UNCTAD – Review of Maritime Transport 2024 (2024) – https://unctad.org/system/files/official-document/rmt2024overview_en.pdf
CMA CGM – Asia to Mediterranean FAK rates (3 Jul 2026) – https://www.cma-cgm.com/news/5510/fak-rates-from-asia-to-the-mediterranean-amp-north-africa
Maersk – Far East Asia to Europe PSS (25 May 2026) – https://www.maersk.com/news/articles/2026/05/25/far-east-asia-europe-pss-june
